


 Log in
 Log out
Hurricane Isaias 2026
Status: Active
| Type of posting | Posting date(EST): | Summary | Downloads |
|---|---|---|---|
| Custom Events | 10/13/2026 12:00:00 PM |

|
|
| 10/12 Update | 10/12/2026 1:00:00 PM |
|
|
| Landfall SSEs | 10/10/2026 10:00:00 AM |
|
|
| Pre-Landfall SSEs #2 | 10/9/2026 10:00:00 AM |
|
|
| Pre-Landfall SSEs #1 | 10/8/2026 12:00:00 AM |
|
|
Custom Events | Summary
Posting Date: October 13, 2026, 12:00:00 PM
Verisk estimates that insured industry losses to onshore property for Hurricane Isaias will fall between USD 1 billion and USD 2 billion. This estimate includes losses due to wind and privately insured estimates of storm surge from Isaias’ landfall in the Florida panhandle. The vast majority of the insured loss is attributable to wind.
ALERT™ subscribers can now download Touchstone® and Touchstone Re™ event sets, loss-based similar stochastic events (SSEs), and hazard shapefiles of the median loss event for the wind and storm surge impacts from Hurricane Isaias from the Downloads tab for this posting on the ALERT Website. Please see the commentary in the download for the loss-based similar stochastic events for guidance on how to best utilize these. The information provided herein is strictly confidential and is solely for the use of Verisk clients; disclosure to others is prohibited unless noted in your Verisk software license.
Modeling Information and Assumptions
The modeled scenarios in the custom event set for Hurricane Isaias released today only include the wind and storm surge perils. Losses from precipitation induced flood are not expected to be significant for this event.
Included in the industry insured loss estimate are losses to onshore residential, commercial, and industrial properties and automobiles for their building, contents, and time element coverage.
The modeled scenarios released today do not include:
- Losses from precipitation-induced flooding
- Losses paid out by the National Flood Insurance Program
- Losses exacerbated by litigation, fraudulent assignment of benefits, or social inflation
- Storm surge leakage losses paid on wind only policies due to government intervention
- Losses to inland marine, ocean-going marine cargo and hull, and pleasure boats
- Losses to uninsured properties
- Losses to infrastructure
- Losses from extra-contractual obligations
- Losses from hazardous waste cleanup, vandalism, or civil commotion, whether directly or indirectly caused by the event
- Losses resulting from the compromise of existing defenses (e.g., natural and man-made levees)
- Loss adjustment expenses
- Other non-modeled losses, including those resulting from tornadoes spawned by the storm
- Losses for U.S. offshore assets and non-U.S. property
Meteorological History of Isaias
On Tuesday, October 6th, the National Hurricane Center (NHC) initiated advisories on Tropical Depression Nine, an area of low pressure over the western Gulf of America that had been tracked as Invest 92L over the Bay of Campeche and was assigned high odds of development. The depression strengthened further on Wednesday, October 7th , and was upgraded to Tropical Storm Isaias, becoming the ninth named storm of the 2026 Atlantic hurricane season. Isaias developed in the midst of a very quiet season that has been suppressed by what is expected to be a record-strong El Niño. Three earlier named storms (Arthur, Bertha, and Edouard) affected the Gulf Coast states with heavy rainfall, but none reached hurricane strength. Isaias, however, strengthened steadily over very warm Gulf waters, and Hurricane Hunter aircraft found hurricane-force winds Wednesday night, leading the NHC to upgrade it to a hurricane at 10:30pm CDT. This ended the longest wait on record for the first hurricane of an Atlantic season.
Isaias continued to intensify overnight into Friday morning, with Hurricane Hunter data showing a better-defined eye, a shrinking eyewall, and flight-level winds supporting an estimated intensity of 95 kt, putting Isaias on the cusp of major hurricane strength. Overnight on the 8 th into the 9th, Isaias underwent a period of rapid intensification, with maximum sustained winds increasing from 80 mph to 110 mph by the NHC’s 4 AM CDT guidance. Shortly thereafter, at around 7:20 AM EDT, an Air Force Reserve Hurricane Hunter aircraft found that maximum sustained winds had further increased to 120 mph, making Isaias a Category 3 major hurricane. With a dropsonde pressure of 969 mb, Isaias’s central pressure had dropped 16 mb in 24 hours. This intensity was slightly stronger than the recent consensus forecast peak (NHC had been forecasting up to 110 mph), and it was reached despite wind shear that was forecast to increase significantly. Isaias held onto its major hurricane-strength status into the early afternoon while accelerating north toward the Gulf Coast at 15 to 20 mph.
Several factors contributed to Isaias outperforming intensity guidance up to this point, which had largely capped it near Category 2 strength because of the building wind shear forecast for the 9th. First, with very little tropical cyclone activity in the Gulf this hurricane season, Isaias found itself in a Gulf environment very conducive to storm development with near-record warm sea surface temperatures for early October in the mid 80s Fahrenheit. Also working in Isaias’s favor was its small, compact core and wind field; these types of storms can intensify quickly and be more resistant to shear than larger storms. Additionally, the forecast wind shear was slower to materialize than anticipated. By the time shear began to pick up on the afternoon of the 9th, Isaias had already built up a brisk forward speed that effectively limited the amount of time shear had to weaken the storm ahead of landfall. There was also a clear split in forecast models, with Google’s DeepMind model being more aggressive and indicating a 69% likelihood of Isaias Category 3+ by the 12Z model run on the 8th compared to just a 12% likelihood per the European ensemble model (EPS). In fact, the EPS model had a higher likelihood (26%) of Isaias weakening to a tropical storm before landfall.
The growing southwesterly shear on the 9th made the storm noticeably lopsided, with its heaviest convection displaced into the northern half of the eyewall. The wind field also began to rapidly expand, reaching 185 miles from the center by the morning of the 9th from just 90 miles a day earlier, and spread onshore along the northern Gulf Coast by the early afternoon. Isaias had already begun to weaken by this point, with maximum sustained winds decreasing to 115 mph by 4pm CDT and to 110 mph, or Category 2 strength, by 7pm CDT. Conditions along the coast deteriorated rapidly through the afternoon and evening as outer rainbands came onshore, bringing tropical storm conditions building to hurricane conditions and a threat of tornadoes. Power outages in Florida topped 100,000 customers by early evening, before the core of the hurricane even reached the coast. Around 5:50pm CDT, the National Weather Service issued and Extreme Wind Warning for Pensacola and Fort Walton Beach to Rosemary Beach corridor, and gusts of 75 mph were reported in Orange Beach, Alabama and Destin, Florida while a station at Fair Point Light in Pensacola Bay recorded sustained wind of 76 mph and a peak gust of 96 mph.
Hurricane Isaias made landfall near Destin, Florida, around 8:30 pm CDT on October 9th as a Category 2 hurricane with maximum sustained winds of 105 mph and a minimum central pressure of 971 mb. The storm then rapidly weakened after moving inland and transitioned into a post-tropical cyclone over Alabama early Saturday morning. Additional details on hazards observed were shared in Monday’s ALERT.
Damage observations from the affected areas
Isaias made landfall near Destin on October 9 with the most severe wind damage west of the landfall point. Wind shear steered the strongest gusts into Santa Rosa and northeastern Escambia counties, where structural damage, roof damage and many downed trees, particularly in Milton and the communities north of it were observed. Other structural damage included a Pensacola hotel that lost its roof during landfall and damage to some Santa Rosa County schools. Okaloosa County took the eyewall but fared comparatively better, with trees falling onto roofs as the most common damage mechanism. Overall, the damage can be characterized as coming mainly from falling trees, debris, fences, roof cover damage to older homes dominated by wind rather than storm surge. Power outages were extensive across the region, with about 90% of customers losing power in Santa Rosa, 89% in Holmes, 86% in Washington, 85% in Walton, 75% in Escambia and 53% in Okaloosa. In neighboring Alabama, coastal Baldwin County avoided the worst of a direct hit and dealt mostly with downed trees and debris, while fallen trees and power lines were also reported inland as far as Hoover and Montgomery. In Georgia, the weakened post-tropical remnants caused mainly downed trees and power outages, which peaked at more than 120,000 customers, along with reports of trees falling on homes in metro Atlanta.
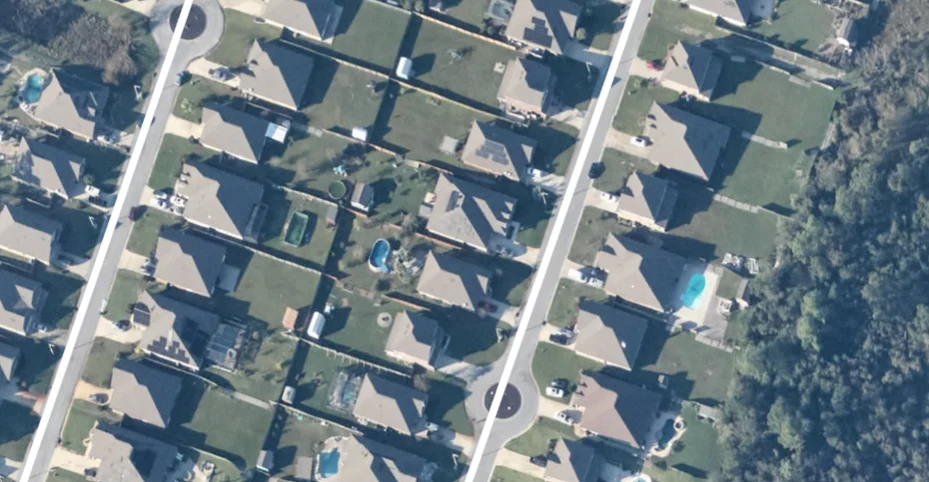
NOAA aerial imagery showing damage to fences and fallen trees just NW of Holley, FL
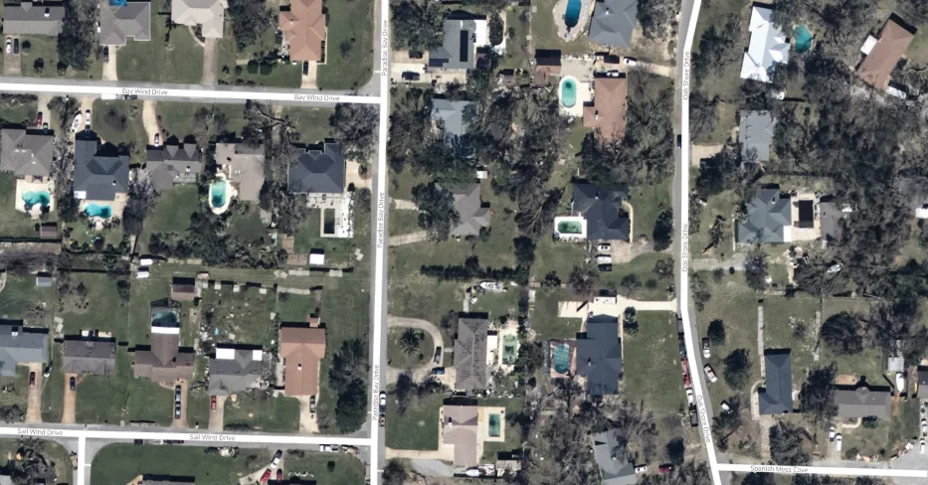
Roof cover damage and downed trees from the north shore of Tiger Point, FL (NOAA)
Other Verisk Resources for Hurricane Isaias
Together with ALERT, GEO and Respond have provided insights on Isaias throughout the storm’s lifecycle. Pre-event, in addition to similar stochastic events, we have shared four daily forecasts of the storm’s wind footprint at landfall via Respond, plus predicted path, arrival times, cone of uncertainty, and later, confirmed track and confirmed arrival times, a Wind Speed Probability layer, and a Potential Storm Surge layer through GEO. Since landfall, the Respond team has developed and shared their final wind footprint to licensees, with over 200 assimilated observations, and the GEO team has begun to provide detailed imagery and damage assessments. Together with ALERT, this suite of Verisk event response solutions has provided a holistic view of Isaias across insurance functions, including claims, underwriting, catastrophe and exposure management - facilitating claims resource management, notification of policyholders, implementation of underwriting moratoriums, understanding total exposure at risk, estimating insured losses, and supporting communication with stakeholders. Please contact your Verisk representative with any questions about our suite of event response and intelligence solutions.
This is the final planned ALERT for Hurricane Isaias.
Custom Events | Downloads
Posting Date: October 13, 2026, 12:00:00 PM
The information provided herein is strictly confidential and is solely for the use of Verisk clients; disclosure to others is prohibited.
Simulated Event Set
These event sets contain five custom created scenarios of Hurricane Isaias. They were developed using the latest version of the U.S. Hurricane model prior to the update in June 2026.
| Product | Version | Description | Download |
|---|---|---|---|
| TOUCHSTONE Re | 12, 13 | Selected set of simulated scenarios |  |
| TOUCHSTONE | 12, 13 | Selected set of simulated scenarios | |
Similar Stochastic Event IDs
These stochastic event IDs are provided based on comparing the industry loss footprint of each custom scenario from the Simulated Event Set to the stochastic model. These are available for the version of the U.S. Tropical Cyclone model released in June 2026 as well as the previous model version.
| Product | File Type | Description | Download |
|---|---|---|---|
| TOUCHSTONE / Re | Excel (xls) | Selected set of stochastic events, with Readme in Excel format | |
| TOUCHSTONE / Re | CSV (csv) | Selected set of stochastic events, formatted for import into Touchstone/Re | |
Additional Downloads
Note: Additional downloads related to the posting are listed below. Please use the appropriate application to view these files.
| Title | File Type | Description | Download |
|---|---|---|---|
| Wind Shapefile | .zip | A shapefile of the median (event #3) wind scenario in mph, with instructions for import into Touchstone | |
| Storm Surge Shapefile | .zip | A shapefile of the median (event #3) storm surge scenario in feet, with instructions for import into Touchstone | |
| Custom Events Overview | .xls | Event parameters and insured industry losses for the five scenarios in the Simulated Event Set | |